
You’re building a financial dashboard. Your client needs real-time candlestick charts rendering 100,000 data points without stutter. You pick a library based on GitHub stars and polished landing pages. Three weeks in, the charts freeze when users zoom. You rebuild from scratch. Deadline blown.
Most JavaScript chart libraries market themselves as “fast” and “flexible.” Few deliver when dataset density climbs past 10,000 records or when your app demands sub-100ms frame rates during live updates.
We ranked JavaScript chart libraries by real-time performance and scalability for large datasets, cutting through marketing claims to show which libraries actually deliver when data density matters.
Our criteria: proven performance capability with massive datasets, chart type breadth and customization depth, framework compatibility and integration ease, developer experience and API simplicity, and production-grade reliability with active support.
Top 8 JavaScript Chart Libraries
Whether you need real-time million-point streaming or quick dashboard components, the right library depends entirely on your data volume, performance requirements, and team’s timeline.
SciChart
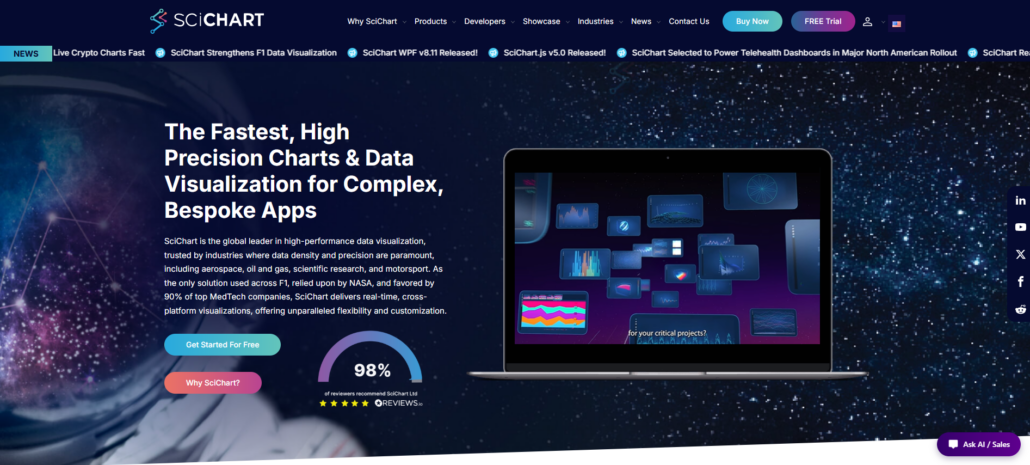
SciChart is one of the best JavaScript chart libraries for demanding applications. Founded in 2012, it built its reputation by tackling a tough problem that most other libraries avoid: handling real-time streaming data at very high densities without breaking down.
Its GPU-accelerated engine keeps things smooth even when you’re pushing well over 100,000 data points, something that causes regular DOM-based libraries to drop frames. Teams in aerospace, oil and gas, scientific research, and motorsport often choose it because the performance and customization options go well beyond what most competitors offer.
This isn’t a general-purpose charting toolkit. It’s engineered for applications where chart performance is a product differentiator, not a feature checkbox. If your datasets measure in the hundreds of thousands and update multiple times per second, SciChart’s architecture justifies the investment.
| Attribute | Value |
| Founded | 2012 |
| Performance Focus | GPU-accelerated rendering |
| Best For | Million-point real-time datasets |
| Industry Trust | Aerospace, scientific research, motorsport |
ApexCharts
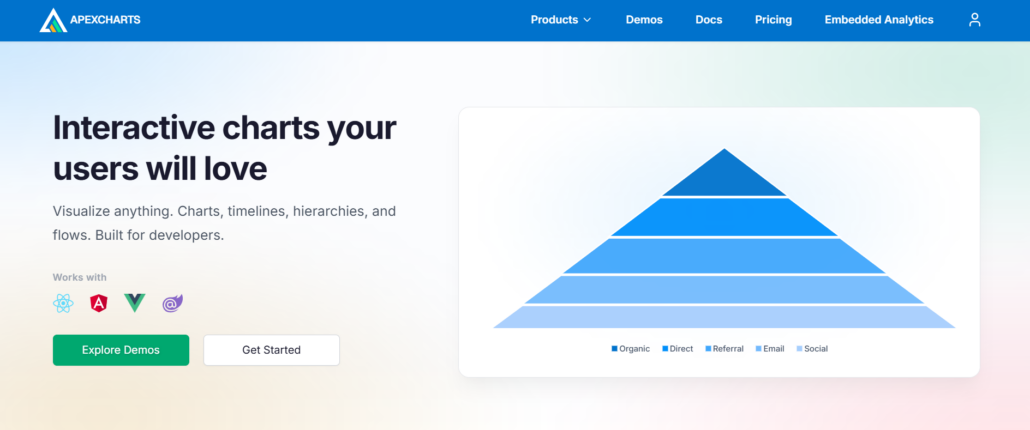
Founded in 2018, ApexCharts ships 20+ chart types with interactive features built-in—zooming, panning, tooltips, annotations, and exporting arrive pre-configured, not as afterthought plugins. Developers skip the assembly phase.
Support spans React, Angular, Vue, and Blazor, making it the go-to for teams standardizing on modern component architectures without wrestling adapter libraries or bridging code.
The developer-friendly approach shows in extensive documentation that assumes you want charts working this afternoon, not next sprint, after decoding API reference tables and hunting Stack Overflow threads for basic setup patterns.
It won’t match GPU-accelerated libraries when rendering millions of real-time data points. For dashboards handling thousands of records with smooth interaction and responsive behavior across devices, though, ApexCharts delivers without the learning curve tax that low-level libraries impose on teams prioritizing velocity over extreme customization depth.
| Attribute | Value |
| Founded | 2018 |
| Chart Types | 20+ with interactive features |
| Framework Support | React, Angular, Vue, Blazor |
| Best For | Rapid dashboard development in modern frameworks |
Fusioncharts
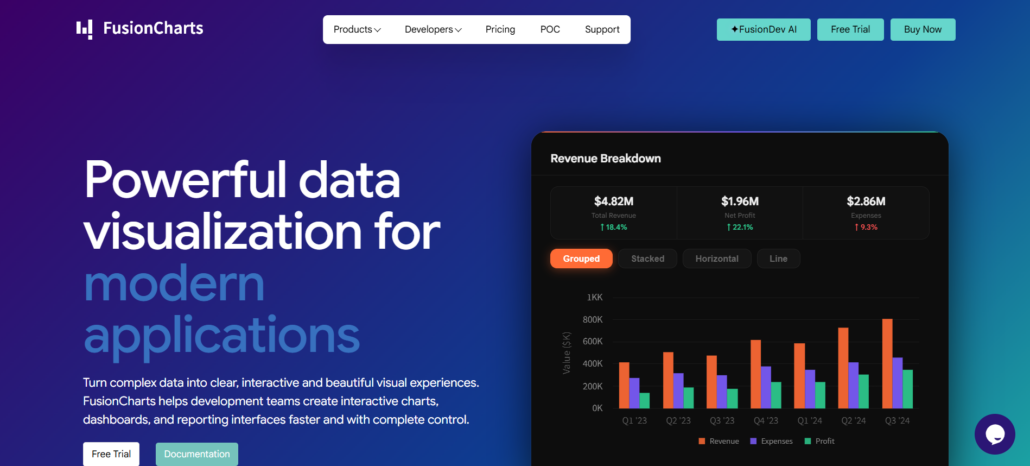
With 95+ chart types, 1,400+ maps, and over 20 dashboards, FusionCharts gives teams a lot of options in one package. It’s especially useful when your dashboards need different visuals like funnels, heatmaps, or maps without mixing libraries.
The library integrates cleanly with React and Angular through consistent wrappers — simple to set up and use. Its engine also lets you write chart code once and deploy it across web, mobile, or embedded projects.
It performs reliably with medium to large-sized datasets of 10K–50K records and offers good interactivity on both desktop and mobile. While GPU-accelerated libraries may edge it out on extreme real-time tasks, FusionCharts wins for teams that prioritize variety and integration ease.
| Attribute | Value |
| Chart Types | 95+, including maps and Gantt |
| Framework Support | React, Angular, Vue with unified API |
| Best For | Multi-framework teams needing chart breadth |
D3 by Observable
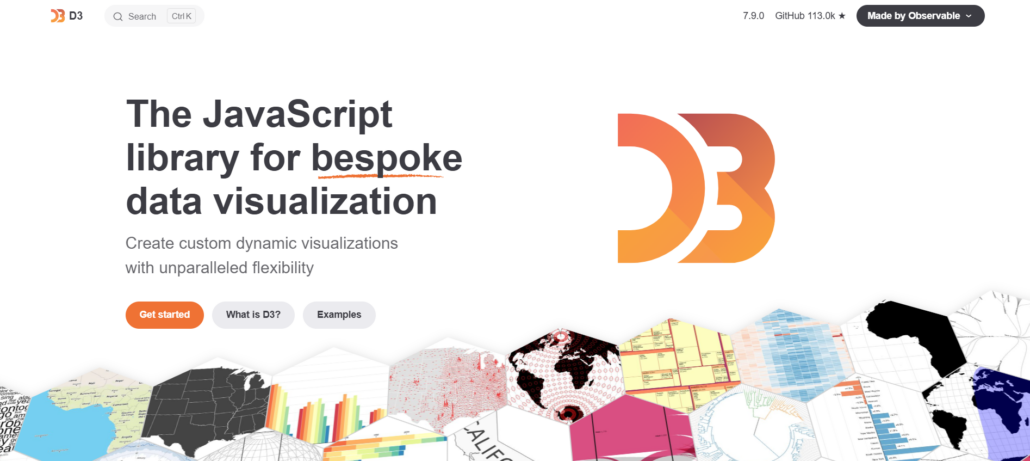
D3, released in 2011, continues to be one of the most respected JavaScript visualization libraries. Rather than offering standard chart components, it provides the raw tools you need to bind data to HTML, SVG, or Canvas and build exactly what you envision.
Its low-level approach has made it a foundation for countless custom dashboards in journalism, research, and business analytics. Performance is solid for most cases thanks to efficient handling of scales, axes, and animations, even if it’s not GPU-accelerated.
The downside is a steeper learning curve. Still, when your project calls for a truly custom interactive map or financial interface, D3’s flexibility makes it worth the investment in development time.
| Attribute | Value |
| Founded | 2011 |
| Best For | Custom, bespoke visualizations requiring full design control |
| Rendering | HTML, SVG, Canvas data binding |
| Notable Feature | Built-in geographic projections and cartographic tools |
Highcharts
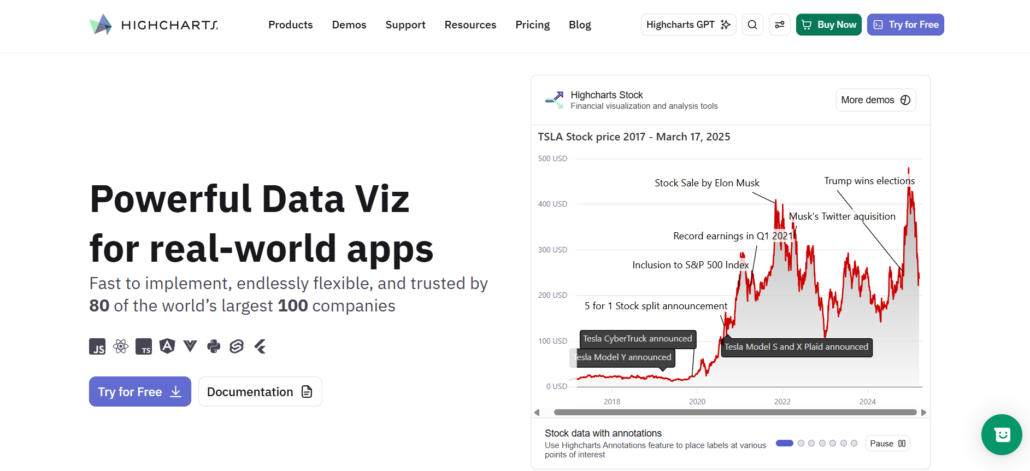
Highcharts delivers Core, Stock, Maps, Gantt, Grid, and Dashboards modules, giving developers a comprehensive toolkit beyond basic charting.
The library prioritizes accessibility and real-world app requirements over flashy demos—every component ships with WCAG compliance built in, not bolted on. Modern framework support, including React integration, means you’re not fighting the library when your stack evolves.
What sets them apart is the mission-driven team with an emphasis on quality and support. They answer questions. They fix bugs. They don’t abandon modules after launch. For teams building dashboards that executives and analysts will actually use—not prototypes that wow stakeholders once—Highcharts delivers the boring reliability that keeps production apps running.
| Attribute | Value |
| Module Breadth | Core, Stock, Maps, Gantt, Grid, Dashboards |
| Framework Support | React, Angular, Vue |
| Best For | Production dashboards requiring accessibility compliance |
| Philosophy | Mission-driven quality over marketing hype |
Plotly
Plotly combines open-source graphing libraries with the Dash framework for building data apps, positioning itself beyond pure charting into full-stack analytics. The platform’s Plotly Studio AI-native analytics and Plotly Cloud publishing layer modernize AI capabilities on top of battle-tested visualization libraries. Worth noting: this isn’t just about rendering charts fast.
Their mission to enable every company to build data apps means you’re getting infrastructure for interactive dashboards, not just drop-in chart components. The open-source core handles standard visualization needs while the commercial platform adds collaboration, deployment, and agentic analytics workflows.
Developers who need both charting primitives and application scaffolding find Plotly’s dual-layer approach compelling—though teams focused purely on embedding high-performance charts into existing apps may find the broader platform scope more than they need.
| Attribute | Value |
| Best For | Data app development with AI analytics |
| Core Offering | Open-source graphing + Dash framework |
| Platform Scope | Visualization libraries to a full analytics stack |
| Unique Angle | AI-native Studio with agentic workflows |
CanvasJS
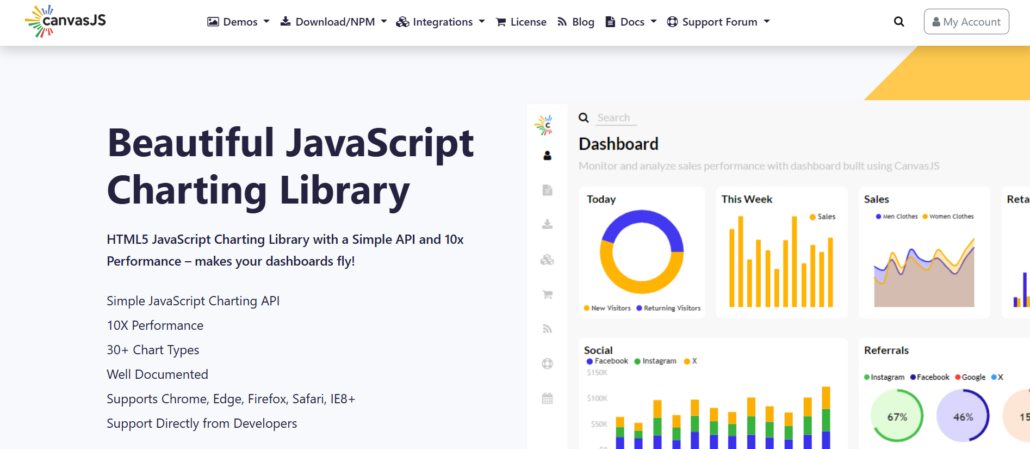
CanvasJS came out in 2013 with 30+ chart types and a strong StockChart module for performance-sensitive work. It runs on HTML5 Canvas, which helps it stay fast when data volumes increase — unlike SVG libraries that can slow down with tens of thousands of points.
You get smooth interactivity for big time-series datasets. The library also offers good compatibility with React, Angular, Vue, and plain JavaScript through a clean, simple API that requires minimal configuration.
It handles real-time updates, zooming, and panning well, even on mid-range hardware. For teams prioritizing speed and easy integration, CanvasJS is a practical option that scales effectively.
| Attribute | Value |
| Founded | 2013 |
| Chart Types | 30+ including StockChart |
| Rendering Engine | HTML5 Canvas |
| Best For | High-density time-series and financial dashboards |
amCharts
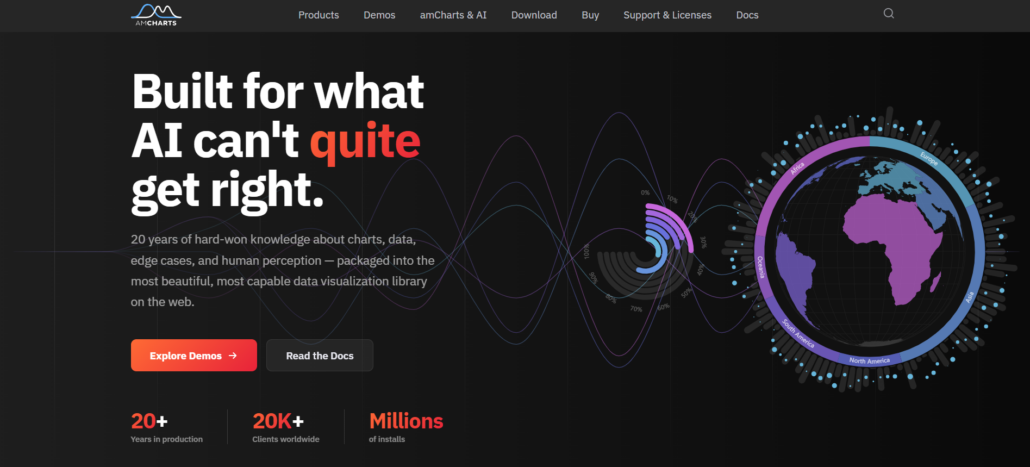
Founded in 2006, amCharts brings 20 years of charting expertise to developers who need both breadth and speed.
The library delivers 60+ chart types, including financial charts with 50+ technical indicators, covering everything from basic line graphs to complex candlestick analysis. Canvas-powered rendering ensures superior performance when datasets scale beyond typical SVG thresholds.
Accessibility is built-in, not bolted on. Trusted by 20,000+ companies worldwide, amCharts handles real-time data feeds without lag spikes that plague lighter libraries. The API balances simplicity for common use cases with deep customization hooks for edge scenarios.
| Attribute | Value |
| Founded | 2006 |
| Chart Types | 60+, including financial/technical indicators |
| Rendering Engine | Canvas (performance-optimized) |
| Best For | Production apps needing chart variety + speed |
Methodology
We ranked these eight JavaScript chart libraries based on what actually matters in real projects:
- Real-time performance with large datasets,
- Customization options,
- Framework compatibility,
- Chart variety,
- Overall developer experience.
Our evaluation drew from the provided profiles, official documentation, and technical specs. Any library that couldn’t clearly show strong scalability or lacked transparent details was left out.
In short, we focused on tools that solve genuine engineering challenges for production dashboards, rather than ones that simply look good on a feature list.
Frequently Asked Questions
Q: What’s the typical cost for JavaScript chart libraries in 2026?
A: Open-source is free but may leave you without enterprise-level help. Paid versions start at a few hundred dollars for one developer and scale up to $2k–$10k for teams. Full enterprise support often costs more than $15,000 yearly, with pricing based on users and deployment scope.
Q: Do they support React, Vue, or Angular?
A: Yes — the better ones have official wrappers or components that integrate cleanly. You won’t usually need to fight with adapters if you pick the right library for your stack.
Q: How many data points can these libraries actually handle?
A: Good ones manage 10,000+ points without lag. High-end options push well past 100,000 using Canvas or GPU acceleration. Real-time or scientific work above 50,000 points needs a library designed for it.
Q: How do they perform on mobile?
A: Modern libraries handle mobile well with responsive design and touch support. Canvas-based ones generally feel snappier. Always test your heaviest charts on actual phones and tablets.
Conclusion
It’s easy to get overwhelmed by those long lists of 15+ JavaScript chart libraries that all blur together. We kept this guide more focused.
The eight libraries we ranked differ meaningfully in areas that matter for real work — handling large datasets smoothly, offering deep customization, and integrating cleanly with your frameworks.
Whether you need extreme performance through GPU power, fine-grained control for unique charts, fast React components, or a complete enterprise solution, each brings something specific.
Start by considering your own stack and data needs. Then run a quick proof-of-concept with your heaviest dataset. That one test often makes the right choice clear.
Leave a Reply